Changing Minds by Using Open Data
Guest post by
Fontys University of Applied Sciences, the Netherlands
The Greek philosopher Pythagoras once said:
“if you want to multiply joy, then you have to share.”
This also applies to data. Who shares data, gets a multitude of joy – value – in return.
ICT is not just about technology – it’s about coming up with solutions to solve problems or to help people, businesses, communities and governments. Developing ICT solutions means working with people to find a solution. Students in Information & Communication Technology learn how to work with databases, analysing data and making dashboards that will help the users to make the right decisions. Data collections are required for these learning experiences. You can create these data collections (artificially) yourself or use “real” data collections, openly available (like those from Statistics Netherlands (CBS) (https://www.cbs.nl/en-gb))
In education, data is becoming increasingly important, both in policy, management and in the education process itself. The scientific research that supports education is becoming increasingly dependent on data. Data leads to insights that help improve the quality of education (Atenas & Havemann, 2015). But in the current era where a neo-liberal approach of education seems to dominate, the “Bildung” component of education is considered more important than ever. The term Bildung is attributed to Willem van Humboldt (1767-1835). It refers to general evolution of all human qualities, not only acquiring knowledge, but also developing skills for moral judgments and critical thinking.
Study
In (Atenas & Havemann, 2015), several case studies are described where the use of open data contributes to developing the Bildung component of education. To contribute to these cases and eventually extend experiences, a practical study has been conducted. The study had the following research question:
“How can using open data in data analysis learning tasks contribute to the Bildung component of the ICT Bachelor Program of Fontys School of ICT in the Netherlands?”
In the study, an in-depth case study is executed, using an A / B test method. One group of students had a data set with artificial data available, while the other group worked with a set of open data from the municipality of Utrecht. A pre-test and post-test should reveal whether a difference in development of the Bildung component can be measured. Both tests were conducted by a survey. Additionally, some interviews have been conducted afterwards to collect more in-depth information and explanations for the survey results.
For our A/B test, we used three data files from the municipality of Utrecht (a town in the center of the Netherlands, with ~350,000 inhabitants). These were data from all quarters in Utrecht:
- Crime figures
- Income
- Level of Education
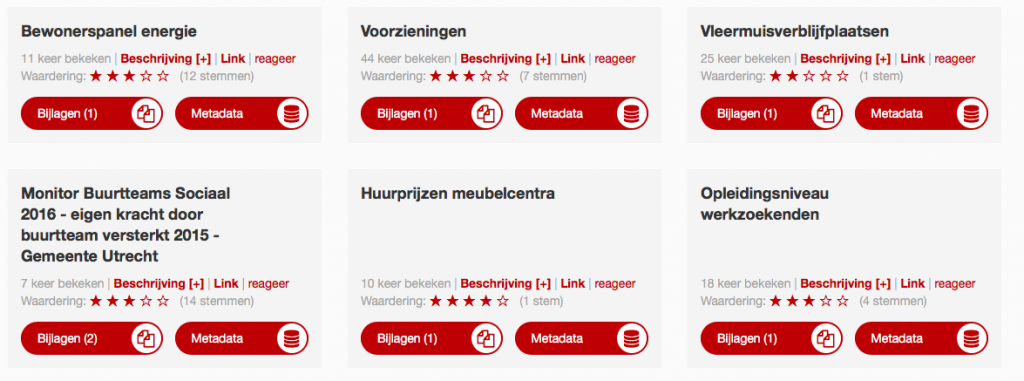
(Source: https://utrecht.dataplatform.nl/data)
We assumed, all students had opinions on correlations between these three types of data, e.g. “There is a proportional relation between crime figures and level of education” or “There is an inversely proportional relation between income and level of education”. We wanted to see which opinions students had before they started working with the data and if these opinions were influenced after they had analyzed the data.
A group of 40 students went to work with the data. The group was divided into 20 students who went to work with real data and 20 went to work with ‘fake’ data. Students were emailed with the three data files and the following assignment: “check CSV (Excel) file in the attachment. Please try this to do an analysis. Try to draw a minimum of 1, a maximum of 2 conclusions from it… this can be anything. As long as it leads to a certain conclusion based on the figures.”
In addition, there was also a survey in which we tried to find out how students currently think about correlations between crime, income and educational level. Additionally, some students were interviewed to get some insights into the figures collected by the survey.
Results
For the survey, 40 students have been approached. The response consisted of 25 students.
All students indicated that working with real data is more fun, challenging and concrete. It motivates them. Students who worked with fake data did not like this as much. In interviews they indicated that they prefer, for example, to work with cases from companies rather than cases invented by teachers.
In the interviews, the majority of students indicated that by working with real data they have come to a different understanding of crime and the reasons for it. They became aware of the social impact of data and they were triggered to think about social problems. To illustrate, here some responses students gave in interviews
“Before I started working with the data, I had always thought that there was more crime in districts with a low income and less crime in districts with a high income. After I have analyzed the data, I have seen that this is not immediately the case. So my thought about this has indeed changed. It is possible, but it does not necessarily have to be that way.” (M. K.)
“At first, I also thought that there would be more crime in communities with more people with a lower level of education than in communities with more people with a higher level of education. In my opinion, this image has changed in part. I do not think that a high or low level of education is necessarily linked to this, but rather to the situation in which they find themselves. So if you are highly educated, but things are really not going well (no job, poor conditions at home), then the chance of criminality is greater than if someone with a low level of education has a job.” ( A. K.)
“I think it has a lot of influence. You have an image and an opinion beforehand. But the real data either shows the opposite or not. And then you think, “Oh yes, this is it.’. And working with fake data, is not my thing. It has to provide real insights.” (M.D.)
Conclusion
Our experiment provided positive indications that contributing to the Bildung component of education by using open data in data analysis exercises is possible. Next steps to develop are both extending these experiences to larger groups of students and to more topics in the curriculum.
References
Atenas, J. & Havemann, L. (2015). Open Data as Open Educational Resources: Towards Transversal Skills and Global Citizenship. Open praxis, 7(4), 377-389. http://dx.doi.org/10.5944/openpraxis.7.4.233
Atenas, J., & Havemann, L. (Eds.). (2015). Open Data as Open Educational Resources: Case studies of emerging practice. London: Open Knowledge, Open Education Working Group. https://education.okfn.org/handbooks/open-data-as-open-educational-resources/
About the authors
 Erdinç Saçan is a Senior Teacher of ICT & Business and the Coordinator of the Minor Digital Marketing @ Fontys University of Applied Sciences, School of ICT in Eindhoven, the Netherlands. He previously worked at Corendon, TradeDoubler and Prijsvrij.nl
Robert Schuwer is Professor Open Educational Resources at Fontys University of Applied Sciences, School of ICT in Eindhoven, the Netherlands and holds the UNESCO Chair on Open Educational Resources and Their Adoption by Teachers, Learners and Institutions.
 Open Education Working Group


Leave a Reply